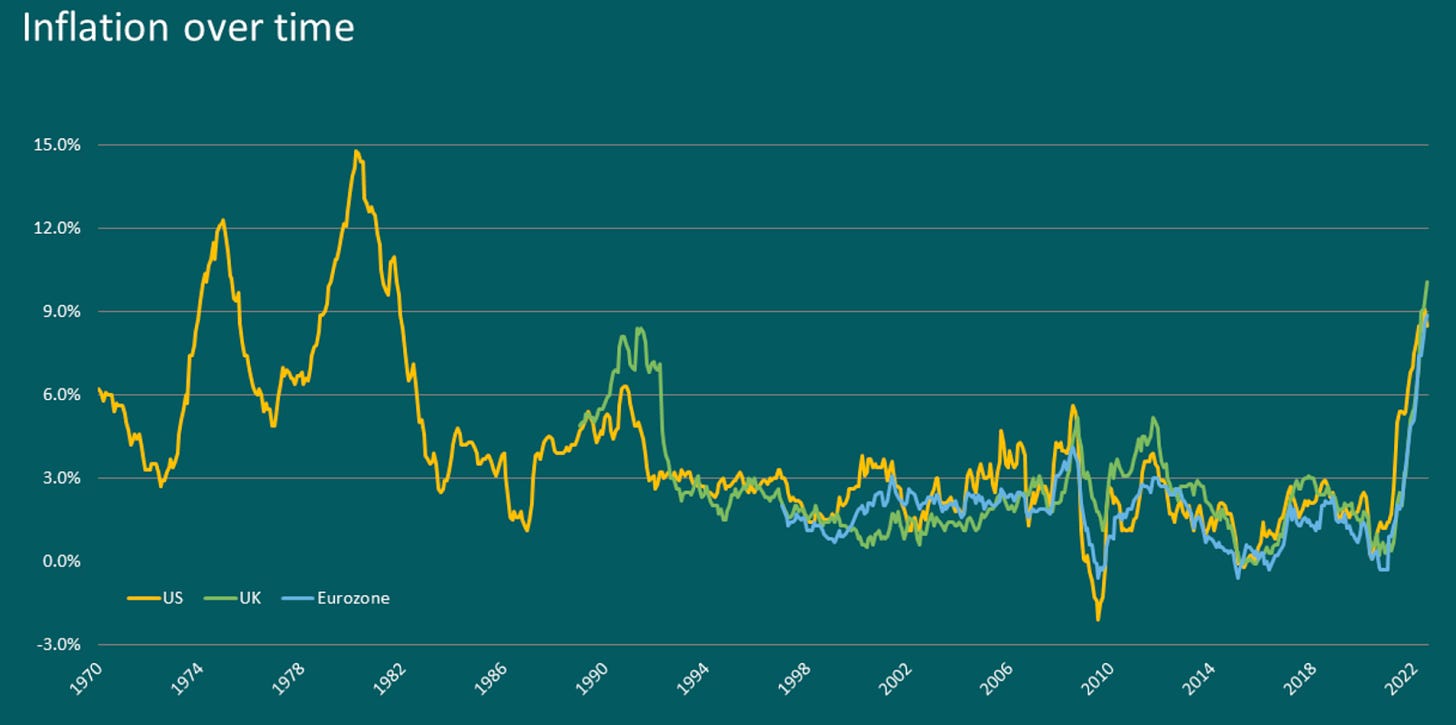
As surely everyone knows by now, the world is experiencing a period of elevated inflation. While this may not phase battle-hardened citizens of countries like Turkey or Argentina, the re-emergence of inflation in the Western world has been a rude awakening after a long period of muted price growth. The chart below puts the recent inflation spike into historical context for the US, UK, and Eurozone.
When inflation started to run hot in early 2021, there were arguments put forward, not least by the Federal Reserve, that it would not continue. To be honest, I bought those arguments at the time. Lockdowns had disrupted global supply chains and capacity utilization, which may have been relatively easy to reduce in response to demand destruction at the start of the pandemic but was difficult to ramp back up in response to a faster than expected demand recovery. Covid had also caused spending to weigh much more heavily toward goods than services, which only served to exacerbate the pressure on supply chains. For example, if you looked past food and energy prices and focused on core categories, then used vehicle and truck prices were the largest drivers of core inflation in early 2021, driven by the global chip shortage that squeezed new car production. So the “transitory” argument did make sense to me. Sure, your usual collection of libertarian cranks were in uproar at this, but such people should probably be ignored at all times, as there are no times at which they are not hysterical about the impending doom of inflation.
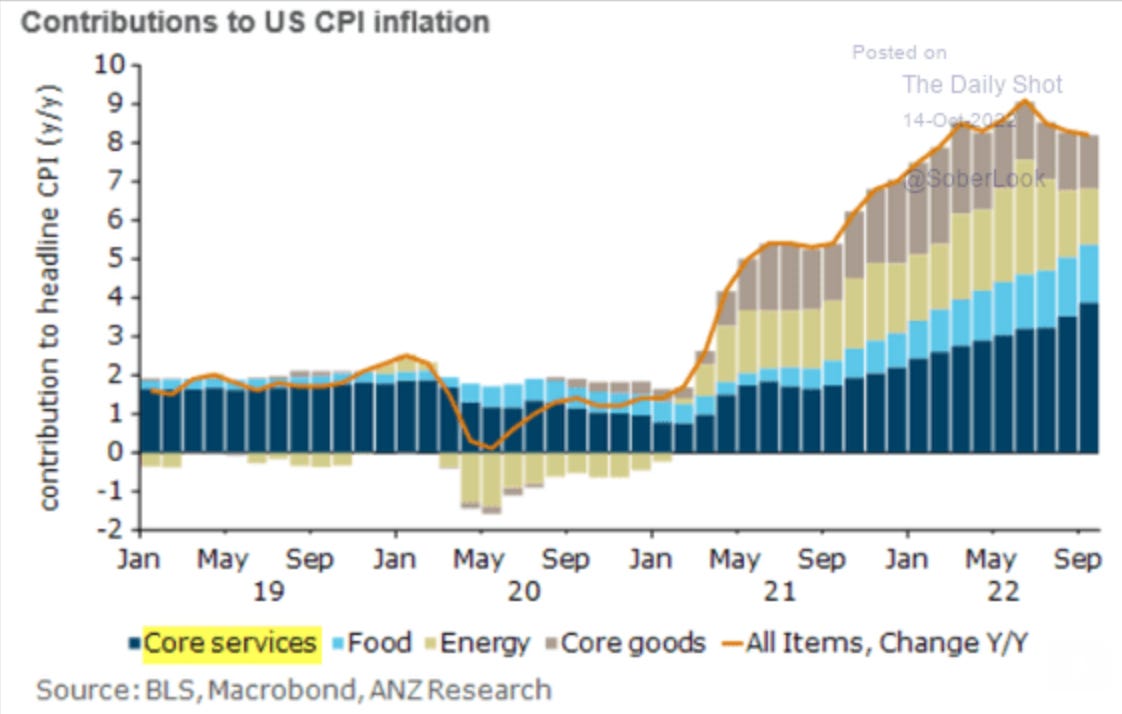
That said, it became clear over time that inflation was becoming entrenched and was spreading broadly across multiple categories. The chart below illustrates how the contribution of core services (the blue bars) to headline US inflation has risen steadily, even as the contributions of energy and core goods have decreased in recent months. In fact, services inflation now exceeds goods inflation and is at a 40 year high.
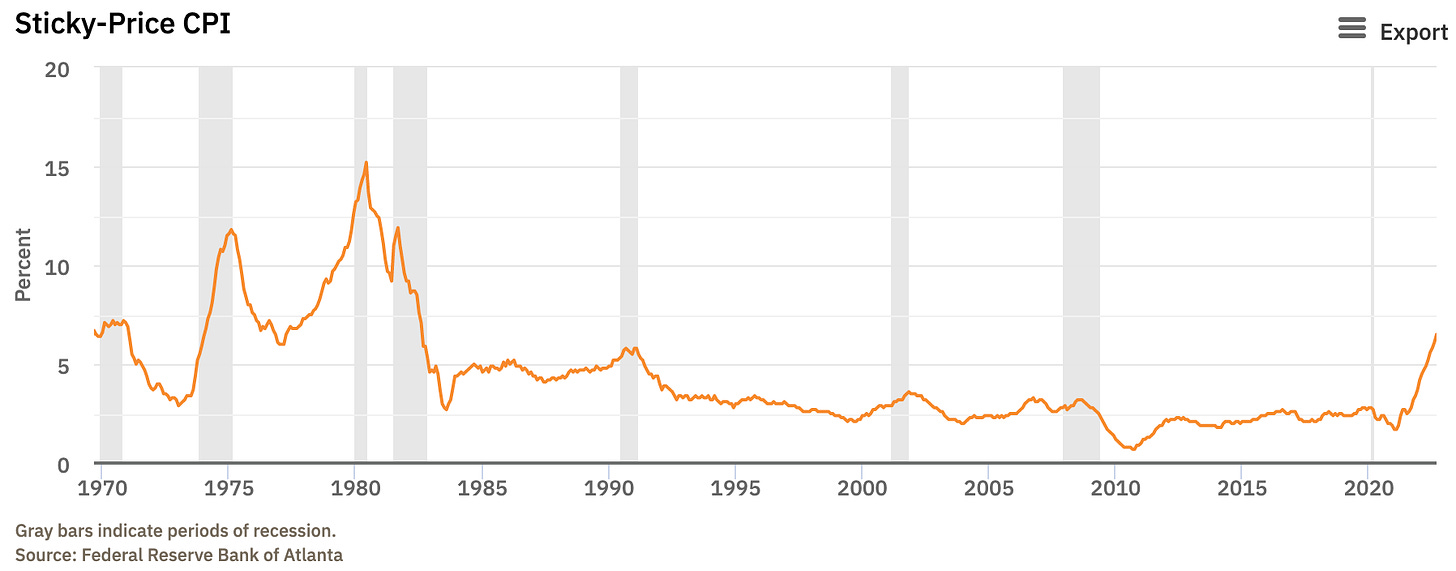
If you look at the prices of items deemed to be “sticky”, i.e. items where prices change relatively slowly, then recent measurements show prices to be increasing at their fastest rate in the US since the 1980s. According to data from the Atlanta Fed measure, the sticky-price CPI rose 6.5% year-over-year in September, up from 6.1% in August and 5.8% in July. This provides a gloomy read into how entrenched inflation has become.
A similar picture emerges if you look at measures like trimmed mean CPI or median CPI, both designed to exclude the biggest outliers driving inflation. They are at their highest since the data series began in 1984.
In short, there is now little debate that our friend will not go gentle into that good night. Some would argue that this is because inflation was never really about supply-constraints after all, but rather was caused by the unprecedented monetary and fiscal stimulus launched by governments in 2020 in response to Covid. This left consumers flush with cash that they are still deploying in an economy that lacks the capacity to meet their demands and also caused wages to be bid up by employers who needed to entice workers away from generous unemployment benefits and provide extra compensation for the risk of contracting Covid.
I can see merits to both the supply argument and the demand argument, but believe it is actually more interesting to think about the psychology of inflation. It is by now conventional wisdom than inflation can become self-fulfilling, but perhaps it is underestimated just to what extent this may be true. Professor Aswath Damodaran phrased this idea potently on a podcast earlier this year and it struck me more forcefully than it had before (emphasis mine):
There is no easy pathway out, which is one reason early last year I argued that even if you believe that inflation was transitory, the thing to do was to act as if it was not and act quickly. I've described inflation as the genie in a bottle. As long as it's in the bottle, you can look at it, you can laugh about it, but you let it out of the bottle, getting it back in is really difficult to do.
This idea of the genie in the bottle seems to refer to the concept of inflation expectations, the importance of which was driven home by Milton Friedman in the late 1960s. At that time, macroeconomics had adopted the simplistic Phillips curve as the primary mental model for evaluating the trade-off between unemployment and inflation. A high level of unemployment was taken as a good measure of slack in the economy, in which environment sellers would gradually cut their prices. A low level of unemployment was taken to mean a tight economy, in which environment sellers would raise prices. All reasonable, but the problem with the Phillips curve was it posited not merely a qualitative, real-world relationship between these two variables, but rather a stable, inverse mathematical relationship. Friedman pointed out that the trade-off between unemployment and inflation implied by the Phillips curve was at best only temporarily stable:
...there is always a temporary trade-off between inflation and unemployment; there is no permanent trade-off. The temporary trade-off comes not from inflation per se, but from unanticipated inflation, which generally means, from a rising rate of inflation. The widespread belief that there is a permanent trade-off is a sophisticated version of the confusion between “high” and “rising” that we all recognize in simpler forms. A rising rate of inflation may reduce unemployment, a high rate will not.
In other words, it is not the absolute level of inflation that is an issue, but rather when inflation is higher than expected. Hypothetically, if inflation was going to be 10% in a given year and everyone expected this, workers could demand a 10% pay rise to keep the real value of their earnings stable, while businesses could increase prices by 10% to offset this. It would not come as a shock to anyone, because…well…they expected it. But if inflation was expected to be 5% and in fact came in at 10%, the real value of a worker’s wages would be eroded. Having just been shocked by an unanticipated level of inflation, workers would likely expect higher future inflation and consequently demand greater pay rises and/or seek better paid work. Businesses would then need to raise prices to offset the margin impact of paying up to retain their workers, which would further contribute to inflation and thus the so-called wage-price spiral would begin.
That’s the theory anyway. Whether it works exactly that way in practice is debatable. Regardless, Friedman’s key insight was that expected inflation was a determinant of actual inflation. In other words, once expectations take hold for a certain phenomenon to emerge, those expectations become self-fulfilling. I think we all can accept the basic psychology of this as uncontroversial. Just think back to March 2020 and toilet paper mania:

The question of psychology is crucial, it seems to me, because if you believe that inflation is fundamentally just a series of price increases across a basket of items, all of which have their own supply and demand dynamics that can be addressed case by case, then you could argue for a scalpel instead of the mallet that is central bank monetary policy. But if you believe the true, pernicious nature of inflation lies in its properties as an emergent, self-fulfilling phenomenon, then perhaps it really is only the mallet brought down on people’s heads that will bring down actual inflation and inflation expectations.
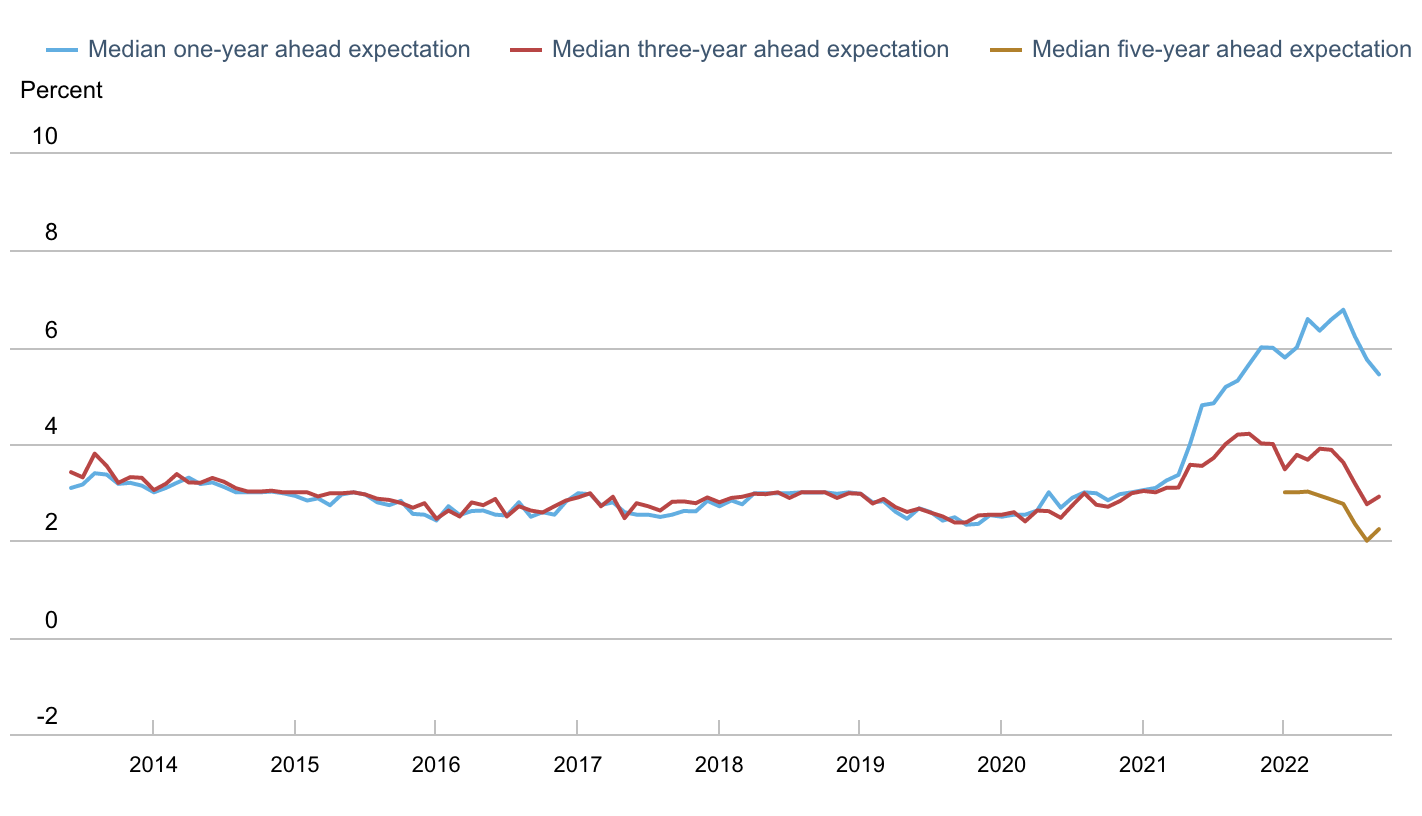
One of the most commonly cited sources of consumer inflation expectations is the New York Fed Survey of Consumer Expectations. Looking at the latest data, you can see a marked spike in inflation expectations, starting in 2021 when actual inflation began to rise. As of September, the median inflation expectation looking one year ahead is now 5.4%. Looking three years ahead it is 2.9% and looking five years ahead (data collection for which only began in Jan 2022) it is 2.2%. There is a wide dispersion of expectations, however, ranging from 1.8% to 9.1% for the one year inflation expectation and from 0.0% to 6.0% for the three year inflation expectation.
You could point to two more or less positive aspects of the chart above though: 1) that inflation expectations have started to decline since July, and 2) that there is still a wide gap between the one-year chart and the three and five year charts, suggesting consumers do not expect a prolonged period of high inflation. That said, a 5.4% reading looking one year out would provide little more than cold comfort to the Fed, which officially is still promising to bring inflation back down to 2%.
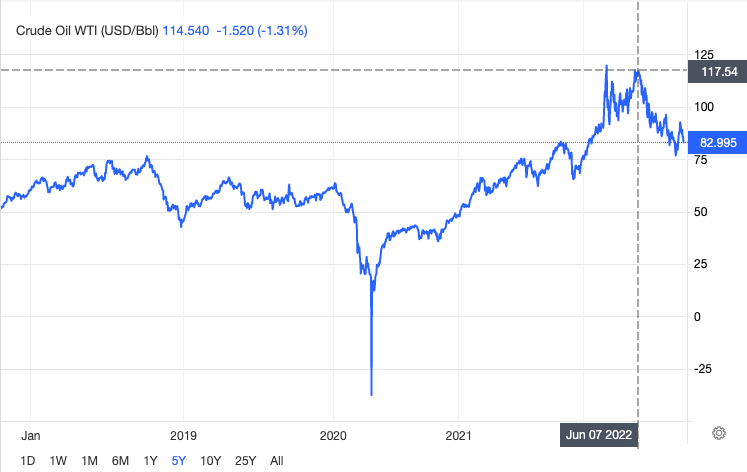
When you look at the oil price, which began to decline in June, then it makes sense than inflation expectations started to come down in July. I have often wondered whether inflation expectations represent the most important passthrough mechanism between headline CPI and core inflation as a result of the impact that energy prices have on consumer psychology.
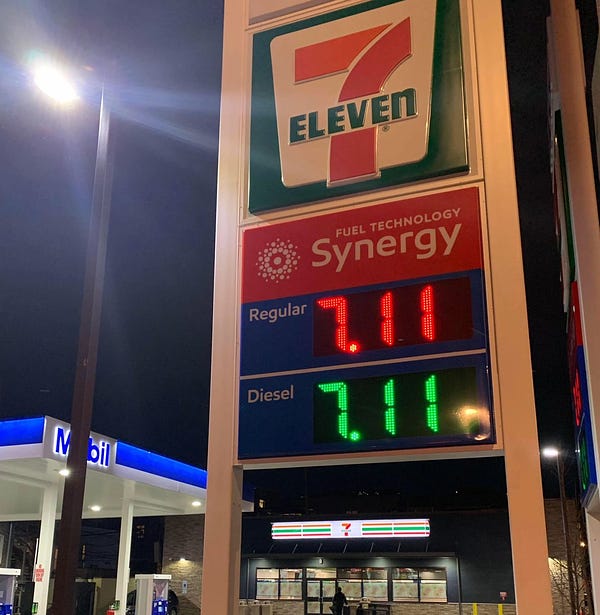
This seems plausible because gas/petrol prices are a significant part of household budgets, especially in the US where there is little alternative to driving in most places. It also might reflect how visible and omnipresent gas prices are, as result of which they are likely to be the most tangible manifestation of inflation for many consumers. When you go to the supermarket for your weekly grocery shopping, you might be perplexed at why the bill is getting larger even though you don’t seem to be buying much more than usual. Putting two and two together you might suspect that inflation is the culprit. Gas prices, on the other hand, do not require even brief moments of mental accounting as they are displayed in real time wherever you go, communicating to you in illuminated red and green whether they are eating more deeply into your budget or not. At such times I doubt most consumers remind themselves of the difference between headline and core inflation or of the effect of the war in Ukraine on energy markets. Instead they probably view frightening gas prices on display as INFLATION writ large.
You might ask then why core inflation hasn’t declined along with declining oil prices. Well, if you look at measures of core inflation such as CPI ex food and energy or Sticky CPI then it hasn’t, but if you look at the PCE index (the Fed’s preferred measure of core inflation) then inflation actually has subsided a bit from 7.0% year-over-year in June to 6.2% year-over-year in August. But the key insidious message of the genie in the bottle analogy is that declining energy prices by themselves might not be enough to reduce inflation expectations and, along with them, core inflation considerably. It might take something more powerful to dislodge inflation psychology.
Most people in the Western world have little memory of inflation and have not themselves been through a sustained period of rising prices and high interest rates. The emergence of inflation would have come as a shock and triggered some multi-stage emotional processing. As inflation crept higher each month in 2021 and then stayed high, we’ve seen abundant references to the 1970s and stagflation. Doom loops have spread by word of mouth and on social media. Such viral narrative contagion has contributed to inflation expectations. Arguably even at the best of times, but certainly during times of stress, purchasing behavior is driven less by data and more by emotion.
Anyway, if this all sounds very loose and speculative, that’s because it is. And that’s the point. I have seen and read a lot of commentary that attempts to break down this inflation cycle quantitatively, but not so much that looks at the psychological aspects, even though they may be more important. Maybe because there isn’t a huge amount of marketable commentary that can be made on the irrational continuum of human behavior driving inflation. Or maybe because it’s obvious to everyone except me.


